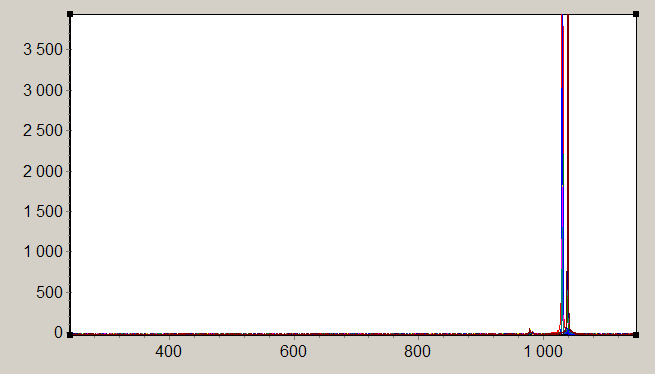
For example, let’s open files p6_1.Master.Scope - p6_9.Master.Scope from directory <Spectrum installation directory>\samples\oo. These are spectrum data acquired by spectrum analyzer Ocean Optics.
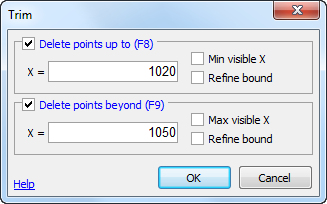
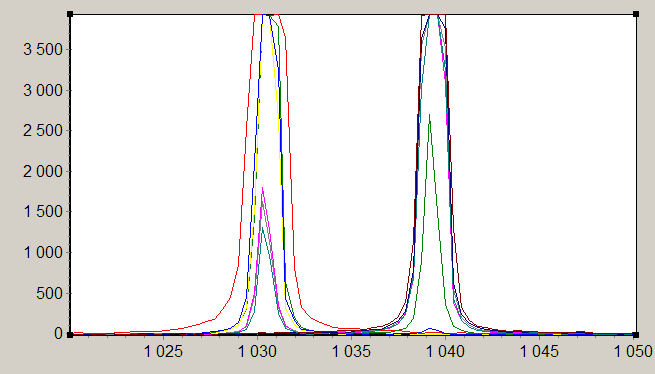
Files contain a lot of values corresponding to whole wavelength range the device can measure. Obviously the most of these values absolutely have no meaning for us. Suppose we know that central wavelength of signal is about 1035 nm. It can be easily uncovered at first glance on the plot. Select all the graphs (Ctrl+A) and remove redundant points (T), preserving only the range containing meaningful data: If plot axes are not in automatic limits mode let’s turn them into (Alt+=) and watch the result: |