Spectrum is powerful application intended for plotting, processing,
transformation, and analyzing of numerical data. With help of Spectrum you can easy plot and manipulate your experimental data or signals,
acquired from various measurements equipment; computation results obtained in numeric table form. Spectrum is intended for using in education, engineering or scientific work.
Regular software of much of measurement instruments (spectrum analyzers, oscilloscopes, counters)
stores collected data in files containing data in textual form.
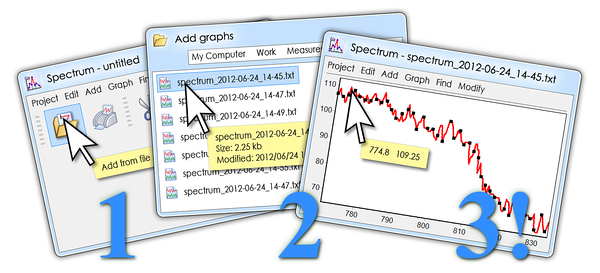
You can easy import such files into Spectrum to process obtained information. The main investigated object in Spectrum is a graph.
A data for graphing can be obtained not only from files but also from Clipboard,
custom expression (formula), or other graphs. You can handle graphs in many ways:
summarize, multiply, scale, normalize them, etc., and you have not to care about
what happens with certain points. In the same time you can get the value of each
individual point if you need it. Program provides a lot of options to tune look of graphs and diagram appearance,
so charts, that you can make with Spectrum, are quite suitable to be displayed in
various printings, reports, documents, presentations.
 |
